The Unjournal · evaluation data · version 2 · 16 October 2026
What the ratings tell us: scales, agreement, intervals, and what to change
A reanalysis of the numbers our evaluators give: 116 evaluations of 61 papers, roughly 1,000 ratings (public data, dashboard, earlier posts). We ask what the numbers mean, what patterns they show (including signs that evaluators use the scales differently or systematically favor some kinds of work), how much evaluators agree, whether their stated uncertainty matches that disagreement, and which questions are worth asking.
The goal behind all of this: ratings that readers can rely on and compare across evaluators and papers, with honest uncertainty, at a cost in evaluator time that is worth paying. Many of the patterns here could reflect genuine biases or just different readings of the scales; without experimental variation (randomizing who evaluates what, or how questions are asked) it is hard to tell these apart.
AI-generated working draft. This page was produced by AI from a combination of human prompting (David Reinstein), a GPT-5 Pro Deep Research report, and analysis and writing by ClaudeClaude Fable 5.1 and Claude Opus 5.5, with some checking runs done by cheaper Claude models.. A person has directed it but has not yet checked every number or sentence. We track human review through the Hypothes.is comments on this pageSections a person has read and adjusted carry a "human-reviewed" mark on the heading, with the date. Unmarked sections are AI output that has only been skimmed.; sections marked human-reviewed have been read and adjusted by a person.
Almost all of the interpretation and suggestions here were generated by AI. We're leaving them up because they seem reasonable and are worth discussing, but they are not yet The Unjournal's priorities or decisions. We want more human review, ours and yours, before acting on them.
Please comment. Select any text to annotate it with Hypothes.is (the sidebar opens on the right; a free account is needed to post). We'll be commenting here ourselves, and we'll adjust, correct and improve the page in response. Expect it to change.
Code and public data: unjournal/unjournaldata.
Main findings human-reviewed 16 Oct
The numbers are computed from our data; the wording and interpretation were drafted by AI. Each finding has a fold with how we got it. Dotted underlines are terms with a short definition on hover or tap.
- Two experts rating the same paper typically differ by about 10 points on our 0 to 100 scales, and often by much more. On the overall rating, the median gap is 9.5 points, one pair in five differs by more than 20, and the largest gap is 40. On "open science" the median gap is 19.
How we got this
For each paper with two or three evaluations, we took every pair of evaluations and the absolute difference of their midpoints on each criterion (54 pairs for overall, 382 pairs pooled over eight criteria). Full table in section 4.
- A single evaluation carries roughly half signal, half noise on overall and methods; much less signal on the other criteria. "Signal" here means differences between papers that evaluators agree on; "noise" means disagreement between evaluators about the same paper, measured by the intraclass correlation and Krippendorff's alphaBoth compare the spread of ratings between papers with the spread between evaluators of the same paper. 0 means evaluators agree no better than chance; 1 means perfect agreement. Defined with formulas in section 4.. Averaging our usual two evaluations raises the share of signal in the paper-level number (from about 45% to about 60% for overall), but for "advancing knowledge" and "open science" even the average is mostly noise.
How we got this
We estimated how much ratings vary between papers versus within a paper (between evaluators). For overall, the spread of evaluators around a paper's mean (about 11 points) is about the same as the spread of papers' means around the grand mean (about 10 points). "Mostly noise even after averaging" uses the same two components: if papers barely differ on a criterion once evaluator disagreement is removed, then averaging two evaluators still leaves a number dominated by disagreement. The basis for comparison is always the spread between papers; no outside truth is needed. Krippendorff's alpha and the intraclass correlationThe share of total rating variance that is due to real differences between papers, rather than to evaluators disagreeing about the same paper. 0.5 means half and half. are both about 0.45 for overall and 0.50 for methods, against 0.23 for advancing knowledge and 0.08 for open science. Details in section 4.
- Evaluators' 90% intervals are narrower than the disagreement between evaluators would suggest, by roughly half. A co-evaluator's best guess lands inside an evaluator's 90% interval about half the time. If each evaluator's interval honestly reflected their own error, and both were aiming at the same thing, we would expect about 70%. Nearly a quarter of evaluator pairs give intervals that don't overlap at all. This is not the test the intervals were designed for.Evaluators were asked for a 90% interval around the "true" percentile, not to predict what another evaluator would say. We use the co-evaluator because there is no observable true percentile. If the two are judging slightly different things, the intervals can be honest and still miss each other.
How we got this, and an important caveat
We can't check intervals against "the truth", because there is no ground-truth percentile. What we can check is whether the intervals are consistent with how much evaluators disagree. Under a simple model (both evaluators aim at the same target and make independent errors whose size matches their own stated interval) the expected hit rate is about 70% for our data. The observed rate is 51%. The caveat: if evaluators are answering slightly different questions (different reference groups, different ideas of what "open science" means) the hit rate would also be low. We can't fully separate "too confident" from "measuring different things", but either way the published intervals understate how much a second expert would differ. Details in section 5.
- Ratings sit high on the scale: 90% of overall ratings are above 50. This is partly expected, because we select promising and relevant work, so it is not by itself proof of leniency. There may also be some leniency: anonymous evaluators rate about 5 points lower than named ones on the same paper. But evaluators choose whether to be anonymous, so this could be selection rather than the effect of being named; a randomized encouragement to anonymity would be the way to find out.
Why this is hard to interpret
The percentile scale asks where a paper sits among "all serious research in the same area" the evaluator has seen recently. If we evaluated a random sample of such research, ratings would be spread evenly from 0 to 100. We don't: papers are suggested and selected. So a well-calibrated evaluator could reasonably give mostly 70s and 80s. To tell selection from leniency we'd need anchor papers that everyone rates. Section 3.
- The overall rating moves mostly with methods, logic and communication, and advancing knowledge. Together these three account for about 84% of the explained variation in overall. Relevance to global priorities accounts for a modest share (roughly 10 to 15%) that it mostly shares with advancing knowledge; open science accounts for almost none.
What "accounts for" means here
We regressed each evaluator's overall rating on their own six sub-ratings (96 evaluations with all six). The sub-ratings explain 74% of the variation in overall. We split that 74% among the sub-ratings using a Shapley decompositionAdds the predictors to the regression in every possible order and averages how much each one raises R². It shares overlapping explanatory power fairly between correlated predictors, instead of giving it all to whichever one the regression happens to pick.. Relevance's unique contribution, after knowing the other ratings, is near zero and statistically indistinguishable from zero, but relevance does correlate with overall (about 0.45 to 0.5). Section 7.
- The "should" and "will" journal-tier answers are often identical, but this may partly be a data artifact. 61% of evaluations entered in 2024 give the same number to both, against 25% of those entered in 2025. Both questions remain on the form, and we think both should stay.
More
On average, "should" (merit) and "will" (prediction) are almost the same number. The 2024 entries were mostly older evaluations transferred from PubPub, so we're checking whether one value was sometimes copied into the other. Section 6.
- There are some fixable data problems. The three most recent evaluation packages (May to September 2026) are missing from the ratings data. Twelve ratings have an impossible interval (midpoint outside its own interval). Since 2025 the "real-world relevance" field almost always equals the "global relevance" field, which looks like an import artifact. And the "within-rater" correlations in our 2025 post partly pooled different people.
Why this matters
None of these is large, but some quietly bias analyses. Treating two copies of one field as two questions inflates their correlation, and grouping by "Evaluator 1" across papers mixes different people. Section 2.
- Frontier LLMs agree with a single human evaluator about as well as a second human does on overall, methods and journal tier. They are not on the same scale as humans, though. GPT-5 Pro rates about 6 points higher and compresses its ratings; Claude Opus 4.6 rates about 8 lower. All the models we tested disagree with humans on open science.
How we compared
For papers with two human evaluations, we compared how well a model's rating tracks one randomly chosen human, with how well the other human does (rank correlation, averaged over 200 random choices). This is fairer than comparing a model with the human average, which is easier to track. Section 9.
Cheapest suggestions (AI-generated, for discussion): (1) show evaluators how much experts typically disagree, right next to the sliders, and warn on very narrow or impossible intervals; (2) replace the open-science percentile with a short checklist; (3) report reliability in percentile points, not just coefficients; (4) fix the data pipeline before doing fancier statistics. These look sensible to us, but we haven't yet decided which, if any, to prioritize. Full list in section 10.
The data, and problems in it
We use the public ratings export: per-paper evaluator labels ("Evaluator 1", "Evaluator 2" within each paper), so no one is identifiable and no one can be followed across papers. A few aggregate checks on repeat evaluators used the private database, with names hashed and only counts reported.
| Criterion | Scale | Ratings | Share of evaluations | With a 90% interval |
|---|---|---|---|---|
| Overall | 0–100 | 113 | 97% | 88% |
| Claims and evidence | 0–100 | 49 | 42% | 98% |
| Methods | 0–100 | 109 | 94% | 90% |
| Advancing knowledge | 0–100 | 110 | 95% | 89% |
| Logic and communication | 0–100 | 112 | 97% | 89% |
| Open science | 0–100 | 110 | 95% | 88% |
| Real-world relevance | 0–100 | 98 | 84% | 90% |
| Global-priorities relevance | 0–100 | 109 | 94% | 89% |
| Journal tier: should | 0–5 | 98 | 84% | 82% |
| Journal tier: will | 0–5 | 90 | 78% | 83% |
About 58% of evaluations are anonymous. Most papers have two evaluations; a few have one or three.
Problems we found
These were worth fixing before anything more sophisticated. Most were fixed on 16 October 2026 and the numbers on this page use the corrected data.
- Missing recent evaluations (now fixed). When this analysis was first run, the three evaluation packages published since February 2026 had no ratings in the database: evaluations submitted through the new form were stored on our server but never copied into the ratings table. That step now runs nightly, and the 2026 ratings are included in the numbers on this page.
- Impossible intervals (mostly fixed). Twelve ratings had the midpoint outside the evaluator's own interval or the bounds reversed; seven were data-entry errors and have been corrected against the published evaluations, and five match the published packages, so the error is in the original evaluation. Examples: overall 83 with interval [93, 100]; methods 75 with [88, 33]; a journal tier of 4.0 with interval [25, 5] (probably 2.5). The new form already enforces lower ≤ midpoint ≤ upper, so these come from older entry routes. Fifteen intervals have zero width (five of them "open science 100 [100, 100]").
- Real-world relevance copied from global relevance. Within an evaluation, the two are identical in 22 of 48 cases entered in 2024, but in 41 of 43 entered in 2025 and all 7 in 2026. The current form has no real-world question, so the import seems to fill it from global relevance. Any analysis that treats them as two questions overstates how similar they are.
- Duplicates and split titles (fixed). 28 rows were exact duplicates from re-entry batches, and two papers appeared under two slightly different titles with one evaluation under each. Both are now corrected in the database; the export also runs automated checks for these problems.
- "Within-rater" correlations in the 2025 post. The 2025 post computed correlations across papers "within each evaluator", grouping by the evaluator label. Of the seven labels with three or more papers, two were the generic "Evaluator 1" and "Evaluator 2", each covering 14 papers rated by different people. They supplied 56% of the paper observations behind the reported figures.
What the corrected numbers look like
Restricting to the five evaluators who were named (and so genuinely the same person across papers), the headline correlations fall: real-world with global relevance from 0.69 to 0.56, methods with overall from 0.55 to 0.46, logic with overall from 0.55 to 0.47. The same pairs still lead. But this rests on five people with three to seven papers each, so it is very imprecise. The right fix is to run evaluator-level analysis privately with a stable hashed evaluator key, and publish only aggregates.
How evaluators use the scales
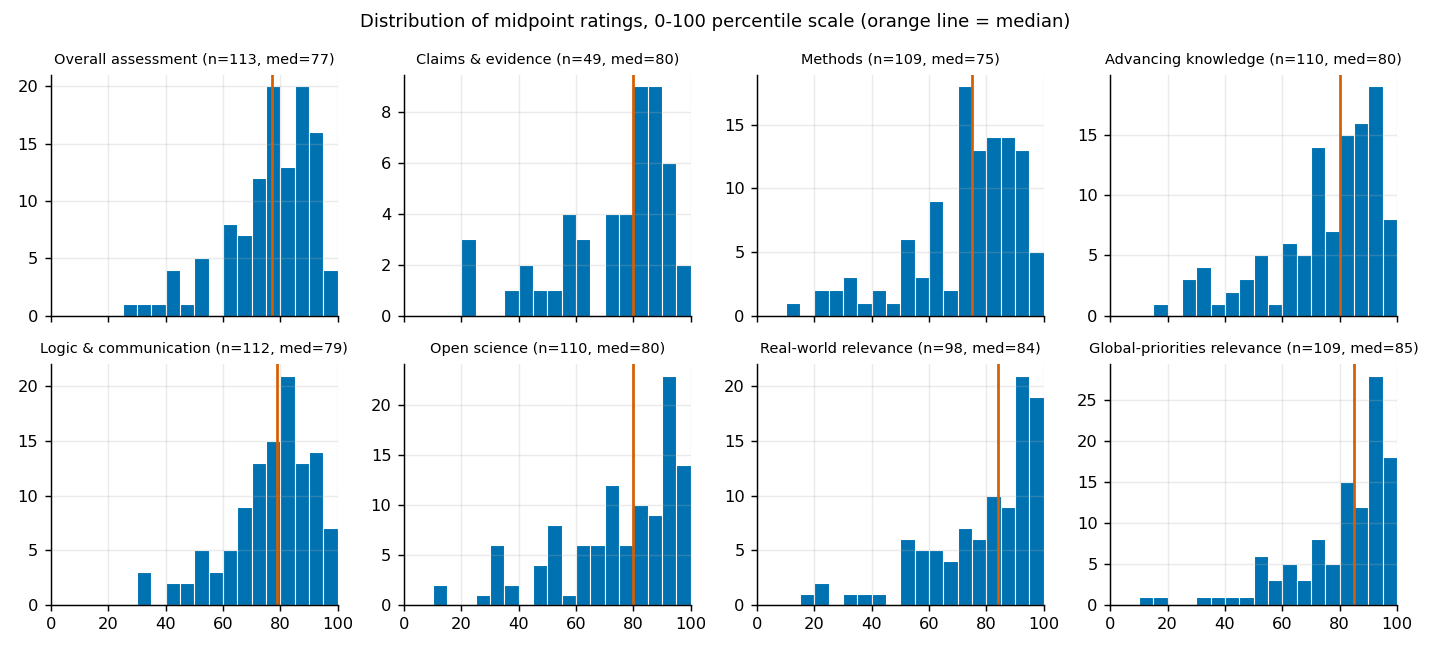
| Criterion | Mean | Median | Share ≥ 80 | Share ≤ 30 | On a multiple of 5 |
|---|---|---|---|---|---|
| Overall | 75 | 77 | 46% | 2% | 77% |
| Claims and evidence | 71 | 80 | 52% | 6% | 70% |
| Methods | 71 | 75 | 41% | 5% | 81% |
| Advancing knowledge | 73 | 80 | 52% | 6% | 79% |
| Logic and communication | 75 | 79 | 49% | 3% | 80% |
| Open science | 73 | 80 | 50% | 8% | 80% |
| Real-world relevance | 77 | 84 | 54% | 4% | 73% |
| Global-priorities relevance | 79 | 85 | 66% | 3% | 82% |
Three things stand out.
- High placement. As discussed above, this mixes selection (we pick promising work) with possible leniency. The relevance questions are highest, which fits selection: we choose papers partly because they're relevant to global priorities.
- HeapingAnswers bunching on round numbers. If 77% of ratings are multiples of 5, the scale is effectively used in 5-point steps, so a difference of 2 or 3 points between papers means little. on round numbers. Three-quarters of ratings are multiples of 5. That's normal for this kind of question; it tells us the practical resolution of the scale is about 5 points. Summaries shouldn't report decimals.
- Evaluators do differentiate between criteria. Only 2 of 109 evaluations give the same number on every criterion; the median spread within an evaluation is 25 points.
Interval shapes
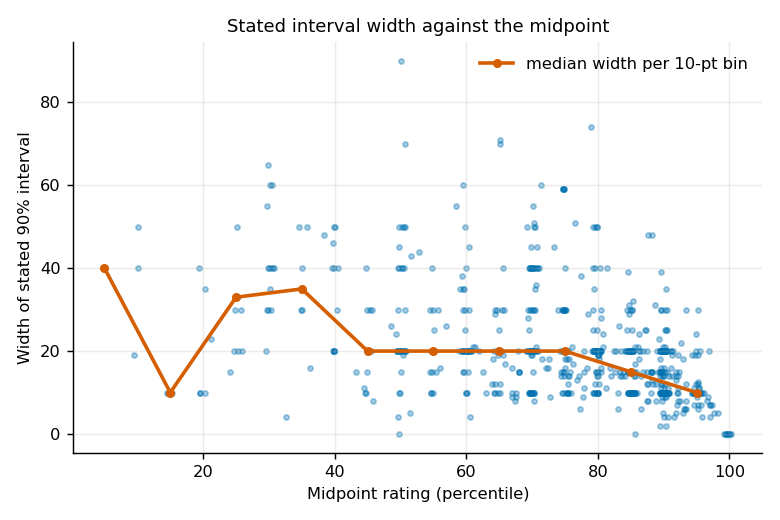
The median 90% interval is 20 points wide (10 to 40 for the middle 80% of intervals). Intervals get narrower as the midpoint rises: median width 30 for midpoints at or below 50, 20 for 50 to 85, and 11 above 85. Some of that is the ceiling at 100. Two-thirds of intervals are symmetric around the midpoint; when they aren't, the longer tail is usually below.
How much do evaluators agree?
The usual summary is a reliability coefficient such as Krippendorff's alpha (definition)α = 1 − (observed disagreement ÷ disagreement expected by chance). It handles missing ratings and different numbers of raters per paper. We use the "interval" version, which treats a 10-point gap as twice as bad as a 5-point gap., with labels like "0.667 is acceptable". These labels hide more than they show. Here are three more concrete ways to read the same numbers.
Reading 1: how much of chance-level disagreement is left
Alpha is defined as one minus the ratio of observed disagreement to the disagreement you'd expect if ratings were shuffled at random across papers. So 1 − α is the share of chance-level disagreement that remains. That makes differences between alphas easier to compare.
Reading 2: the gap in percentile points
This is the most concrete reading. It answers "if I asked a second expert, how far off would they typically be?"
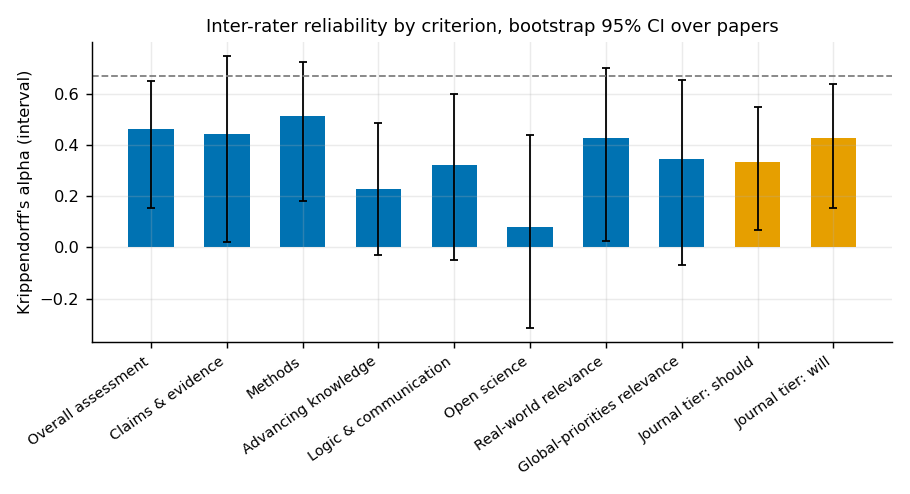
| Criterion | Pairs | Median gap | Mean gap | Gap > 20 | Gap > 30 | α [95% interval] | 1 − α |
|---|---|---|---|---|---|---|---|
| Overall | 54 | 9.5 | 11.6 | 20% | 7% | 0.46 [0.15, 0.65] | 54% |
| Claims and evidence | 19 | 10 | 15.5 | 21% | 16% | 0.44 [0.02, 0.75] | 56% |
| Methods | 51 | 10 | 13.7 | 25% | 10% | 0.51 [0.18, 0.72] | 49% |
| Advancing knowledge | 53 | 10 | 18.5 | 30% | 21% | 0.23 [-0.03, 0.48] | 77% |
| Logic and communication | 54 | 10 | 13.8 | 22% | 13% | 0.32 [-0.05, 0.60] | 68% |
| Open science | 50 | 19.5 | 22.3 | 40% | 26% | 0.08 [-0.32, 0.44] | 92% |
| Real-world relevance | 43 | 8 | 14.1 | 26% | 14% | 0.43 [0.03, 0.70] | 57% |
| Global-priorities relevance | 51 | 10 | 15.8 | 27% | 12% | 0.34 [-0.07, 0.65] | 66% |
| Journal tier: should | 45 | 0.50 tier | 0.74 | > 1 tier apart: 20% | 0.34 [0.07, 0.55] | 66% | |
| Journal tier: will | 40 | 0.40 tier | 0.59 | > 1 tier apart: 15% | 0.43 [0.15, 0.64] | 57% | |
The median gap is about 10 points almost everywhere; what differs between criteria is the tail. On advancing knowledge, one pair in five is more than 30 points apart (the largest gap is 65), which suggests evaluators sometimes read the question quite differently. One likely reason: the guidance packs novelty, practical value, relevance and usefulness to other researchers into one slider.
Why median gap ≈ 10 everywhere but alpha differs so much
Alpha compares disagreement with the spread of ratings across papers. Open science has a moderately large gap and also a smallish real spread between papers (about 6 points once rater noise is removed), so alpha is near zero. Methods has a similar typical gap but a larger real spread between papers (about 13 points), so alpha is higher. A small gap can still mean low reliability if papers barely differ on that criterion.
Reading 3: signal and noise, and what averaging buys
If we think of each rating as the paper's true standing plus this evaluator's error, a reliability of r means true differences between papers account for a share r of the variation and evaluator error for 1 − r. At 0.5 they're equal. This is a model, not a mechanical translation of alpha, but for our data the ICCIntraclass correlation: the share of rating variance due to differences between papers. Estimated here from a one-way random-effects model; numerically close to alpha for our data. and alpha come out almost identical.
The useful consequence: the number we publish is usually the average of two evaluations, and averaging cancels some independent error. The formula is rk = k·r / (1 + (k − 1)·r).
Assumes evaluators are interchangeable and their errors independent. If evaluators share a bias (same reference group, same blind spot), averaging helps less than this.
| Criterion | One evaluation | Mean of 2 | Mean of 3 | Evaluators for 0.8 |
|---|---|---|---|---|
| Methods | 0.52 | 0.68 | 0.76 | 4 |
| Overall | 0.46 | 0.63 | 0.72 | 5 |
| Claims and evidence | 0.45 | 0.62 | 0.71 | 5 |
| Real-world relevance | 0.43 | 0.61 | 0.70 | 5 |
| Journal tier: will | 0.40 | 0.57 | 0.67 | 6 |
| Global-priorities relevance | 0.35 | 0.52 | 0.62 | 8 |
| Journal tier: should | 0.33 | 0.49 | 0.59 | 8 |
| Logic and communication | 0.32 | 0.48 | 0.58 | 9 |
| Advancing knowledge | 0.19 | 0.33 | 0.42 | 17 |
| Open science | 0.09 | 0.16 | 0.22 | 43 |
Formulas and a worked example (for readers who want to check the numbers)
Krippendorff's alpha. α = 1 − Do / De, where Do is the average squared difference between two ratings of the same paper and De is the average squared difference between two ratings drawn from any papers (the chance benchmark). Alpha is 1 when co-evaluators always agree, 0 when they agree no better than two randomly paired ratings, and below 0 when they disagree more than that. The interval version uses squared differences, so a 20-point gap counts four times a 10-point gap. Reference: Krippendorff, Computing Krippendorff's alpha-reliability (2011).
Intraclass correlation, ICC(1). Think of each rating as paper effect + evaluator error. From a one-way analysis of variance we get the mean square between papers (MSB) and within papers (MSW); with k raters per paper, the variance of paper effects is (MSB − MSW)/k and the error variance is MSW. ICC(1) = paper variance / (paper variance + error variance). Reference: Koo & Li, A guideline of selecting and reporting intraclass correlation coefficients (2016).
Worked example, the overall rating. Across the 50 papers with two or more evaluations, the estimated spread (standard deviation) of true paper scores is 10.4 points and the spread of evaluator error is 11.3 points. So ICC(1) = 10.4² / (10.4² + 11.3²) = 108 / 236 = 0.46. Alpha, computed from pairwise differences instead, is also 0.46. For open science the same two numbers are 6.3 and 20.8, giving 40 / 472 = 0.08.
When it tells you something. These coefficients answer one question: can ratings on this criterion tell these papers apart? They depend on how varied the papers are. On a set of uniformly strong papers, even careful evaluators would score near zero, which is why we compare with other pre-selected settings (grants) as well as with journals. They say nothing about whether the level of the ratings is right.
Do evaluators who state narrow intervals agree more? (a first look)
One reading of the low agreement on some criteria is that some evaluators take them seriously and others don't. If so, evaluators who state narrower intervals (a sign of engagement or confidence) might agree more with each other. We split ratings at the median interval width and recomputed alpha within each half. The cells are small (3 to 23 papers) and the pattern is mixed: agreement is higher among narrow-interval raters on the two relevance criteria and advancing knowledge, but lower on overall and methods. So we can't yet say that stated confidence identifies the more informative ratings. A proper test needs more data, or a direct question about effort.
How this compares with journal and grant peer review
Our agreement on the overall rating looks similar to or somewhat higher than what's typically found for journal referees and grant reviewers. Our weaker criteria are about typical. These comparisons are rough, because studies use different statistics and different things are being rated.
| Setting | What was measured | Agreement | Source |
|---|---|---|---|
| Journal reviews, many fields (meta-analysis, 48 studies, 19,443 manuscripts) | Reviewer recommendations, ICC or r² | 0.34 (kappa 0.17) | Bornmann, Mutz & Daniel 2010 |
| Six economics journals (87,114 referee pairs) | Correlation of two referees' recommendations | 0.20–0.25 | Welch 2014 |
| Four leading economics journals | Rank correlation of two referees | about 0.25 | Card & DellaVigna 2017 |
| General medical journal (5,881 reviews) | ICC of recommendations | 0.17 | Kravitz et al. 2010 |
| Grant reviews (UK ESRC, Austrian Science Fund) | Single-reviewer r or ICC | about 0.2–0.26 | Jerrim & de Vries 2020; Mutz et al. 2012 |
| NIH grants, already high-quality applications | ICC, Krippendorff's alpha | about 0 (alpha 0.02) | Pier et al. 2018 |
| NeurIPS 2014 and 2021 (two independent committees) | Correlation of committee average scores | 0.55–0.59 | Cortes & Lawrence 2021; Beygelzimer et al. 2023 |
| The Unjournal, overall rating | Alpha / ICC, single evaluator | 0.45 | This analysis |
Why these comparisons are rough, and why we might expect lower agreement than journals
- Different statistics. Correlations ignore level differences between reviewers; ICC and alpha penalize them. Accept/reject recommendations are coarser than a 0–100 scale.
- Range restriction. Agreement is mechanically lower when the papers being rated are similar in quality. Journal studies cover the full range of submissions, including weak ones; we evaluate pre-selected, mostly strong papers. The NIH study above, restricted to strong applications, found essentially zero agreement, and Erosheva et al. (2021) show grant agreement rises above 0.6 when the full quality range is included. So reaching 0.45 on pre-selected papers is, if anything, encouraging.
- Small sample. Our 0.45 has a 95% interval of roughly 0.10 to 0.67.
Sub-criteria and the overall score in other review systems
NIH grant review shows a pattern much like ours. Across 123,707 applications, the "approach" score (closest to our methods) correlates 0.84 with the overall impact score, significance 0.68, innovation 0.61, and the criterion scores together explain about 75% of the overall score (Eblen et al. 2016). Our methods correlates 0.77 with overall and the sub-ratings explain 74%. We found no published per-criterion reliability for journal manuscripts, and nothing comparable to an open-science rating.
Does training or ranking improve agreement?
Some evidence says yes. An 11-minute training video raised reviewers' agreement on grant vignettes from an ICC of 0.61 to 0.89 (Sattler et al. 2015). Asking reviewers to rank applications rather than rate them raised reliability at the Canadian Institutes of Health Research (Tamblyn et al. 2023). Panel discussion raises agreement within a panel but can lower it between panels (Pier et al. 2017). We found no study of percentile or reference-group scales in manuscript review.
Do some areas agree more than others?
On overall, alpha is 0.69 in environment (6 papers) and 0.16 in global health (13 papers), and slightly negative in development economics (11 papers). These cells are tiny and the intervals would be enormous, so we wouldn't read much into them. Agreement on overall was similar for evaluations entered in 2024 (0.47) and from 2025 on (0.42), so we see no sign that the percentile wording or calibration tool changed agreement yet.
Do the 90% intervals match the disagreement between evaluators?
We ask evaluators for a 90% credible intervalA range the evaluator believes has a 90% chance of containing the "true" value. Here, the guidelines define the true value as the percentile they'd assign "with complete evidence, knowledge, and wisdom". on each rating. There's no observable true percentile to check these against. So comparing with another evaluator's midpoint is not literally a calibration test. We'll call it cross-evaluator coverage: how often does evaluator B's best guess fall inside evaluator A's 90% interval? Evaluators were not asked to predict each other, so a low number here is not a failure on their part. It tells us whether the published intervals convey how much a second expert might differ, which is what a reader would want them for.
On its own, a coverage rate doesn't tell you much, because even perfectly calibrated evaluators wouldn't cover each other 90% of the time. So we compare it with what we'd expect if the intervals matched the evaluators' actual error.
The benchmark, step by step
- Suppose each evaluator's midpoint is the true value plus an error, and their 90% interval reflects the size of that error honestly. An interval of ±10 then implies a typical error (standard deviation) of about 6 points (10 ÷ 1.645).
- Two such evaluators' midpoints differ by the difference of two errors, which is about 1.4 times bigger than one error.
- So B's midpoint falls inside A's honest interval less often than 90%: about 75% if both have the same width, and about 70% using our evaluators' actual mix of widths.
- We observe 51%.
Equivalently: intervals imply a typical error of about 6 points, but the observed disagreement implies a typical error of about 12 points per evaluator on overall, and up to 21 on open science. To reach the benchmark, intervals would need to be about 2.5 times wider.
| Criterion | Pairs | Observed coverage | Expected if realistic | Intervals don't overlap | Error implied by intervals | Error implied by disagreement |
|---|---|---|---|---|---|---|
| Overall | 93 | 63% | 72% | 13% | 6 | 11 |
| Claims and evidence | 37 | 51% | 70% | 22% | 6 | 15 |
| Methods | 90 | 54% | 66% | 24% | 6 | 12 |
| Advancing knowledge | 92 | 52% | 70% | 26% | 6 | 18 |
| Logic and communication | 94 | 52% | 70% | 17% | 6 | 14 |
| Open science | 87 | 37% | 70% | 39% | 6 | 21 |
| Real-world relevance | 76 | 53% | 71% | 18% | 5 | 14 |
| Global-priorities relevance | 88 | 50% | 71% | 23% | 6 | 15 |
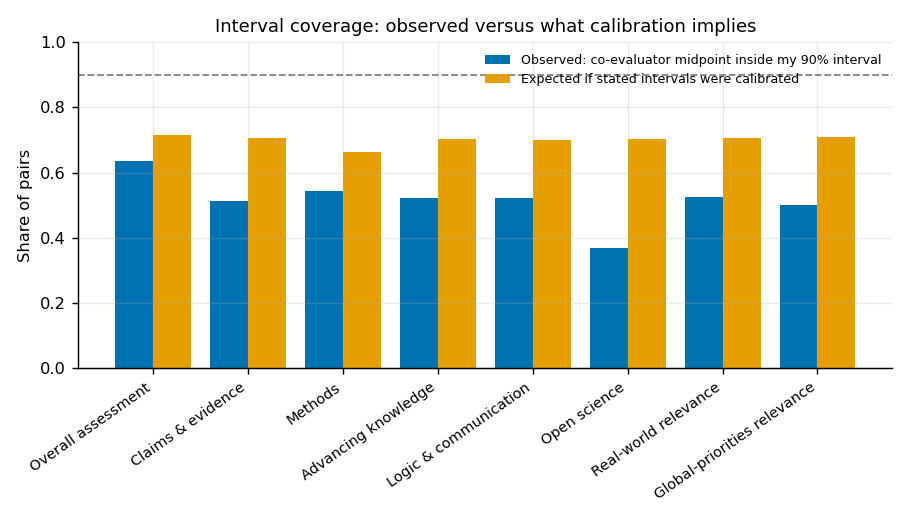
Wider intervals do cover more: 67% for intervals wider than 30 points against 37% for 10 points or less. So the widths carry some information. But an evaluator's own interval width barely predicts how far they end up from their co-evaluator (rank correlation 0.13). There's a little self-knowledge in the intervals, not much.
This is what the research on overconfidence would predict. In many studies, people's stated 90% intervals contain the true answer only 30 to 60% of the time, and experts do only slightly better than novices (McKenzie, Liersch & Yaniv 2008; Moore & Healy 2008). Intervals are often less than half as wide as they should be (Soll & Klayman 2004). Our test is different (a co-evaluator's guess, not a known answer), but "about half as wide as warranted" fits that pattern. Our evaluators look about as overconfident as experts usually are, not unusually so.
Two caveats
Different targets. If two evaluators use different reference groups or read the criterion differently, they aren't estimating the same quantity, and coverage would be low even with honest intervals. Open science is the likely case. This doesn't rescue the intervals as published: a reader wants to know how much another expert might differ.
Shared information. If evaluators share views (same literature, same seminar circuit), they'd agree more than independent evaluators, and coverage would look better than it should. So that caveat cuts the other way.
What a real calibration test would look like
Calibration can be tested properly only where outcomes resolve. Two candidates:
- Anchor papers. A fixed set of papers rated by many evaluators, giving each a reference distribution (e.g. "methods: median 78, middle half 72–84"). An evaluator who consistently rates anchors well above the reference shows a scale-location difference, without pretending the reference is truth.
- Journal-placement forecasts. The "will" tier eventually resolves (see next section). If we asked for probabilities over tiers rather than a midpoint and interval, we could score forecasts properly.
The two journal-tier questions
We ask where a paper should be published on merit (as if journals judged fairly on the stated criteria) and where it will be published. Both are on the form now and we think both should stay. The contrast is the point: it lets evaluators say "this deserves better than it will get" or the reverse, and "will" is the one rating that eventually resolves.
In the data, the two are close. Means are 3.8 (should) and 3.9 (will), and the correlation is 0.73. 44% of evaluations give exactly the same midpoint, and 22% the same midpoint and interval.
| Entered | Evaluations | Same midpoint | Should > will | Will > should | Mean should − will |
|---|---|---|---|---|---|
| 2024 | 46 | 59% | 22% | 20% | +0.04 |
| 2025 | 38 | 24% | 32% | 45% | -0.08 |
| 2026 | 5 | 20% | 20% | 60% | -0.30 |
The drop from 61% to 25% identical is large enough to suspect the transfer, not the evaluators. We're checking the 2024 rows against the published evaluations. If evaluators really do give different answers more often than the 2024 data suggest, the distinction is doing more work than it appears.
Our 2025 post got this wrong
The October 2025 post's test section found no significant difference (−0.03 tiers, p = 0.63), but its conclusion said evaluators "consistently" rate merit above prediction "(p < 0.001)". The conclusion was a hard-coded sentence that wasn't updated when the data changed. We've corrected the source and added a note to the post.
Do the "will" predictions come true?
Early evidence says somewhat. For 13 evaluated papers now published in journals that we could place on the 0–5 tier scale, the average predicted tier has a rank correlation of 0.71 with the actual tier. Predictions were slightly optimistic on average (+0.2 tiers; mean absolute error 0.5). 11 of the 18 evaluator intervals (61%) contained the actual tier. Papers already published in top journals had been predicted at 4.1 on average, against 3.7 for those still unpublished.
Caveats on this check
We assigned tiers to journals by hand using the guidelines' descriptions (for example, AER and Econometrica as 5, AER: Insights and Management Science as 4, Economic Journal 3.5). Those assignments should be checked. Some evaluations were done after acceptance, though the form asks evaluators to predict as if they didn't know. Thirteen papers is a small sample.
What the overall rating is built from
The question. When an evaluator gives a paper its overall rating, how closely does it track their own ratings on the other criteria?
The method. For the 96 evaluations that rated overall and all six older sub-criteria, we regressed overall on the six sub-ratings. Together they explain 74% of the variation in overall (R² = 0.74). To split that 74% among the six, we used a Shapley decomposition, which shares the explanatory power of correlated predictors fairly instead of letting the regression arbitrarily favor one.
| Criterion | Correlation with overall | Share of explained [95%] | Unique effect [95%] |
|---|---|---|---|
| Methods | 0.77 | 36% [24, 47] | 0.42 [0.27, 0.58] |
| Logic and communication | 0.68 | 24% [13, 36] | 0.28 [0.13, 0.44] |
| Advancing knowledge | 0.67 | 23% [11, 30] | 0.30 [0.12, 0.48] |
| Real-world relevance | 0.52 | 9% [4, 17] | 0.13 [−0.13, 0.38] |
| Global-priorities relevance | 0.45 | 6% [3, 15] | −0.10 [−0.33, 0.14] |
| Open science | 0.19 | 2% [1, 7] | −0.04 [−0.16, 0.09] |
What this means.
- Overall moves most with methods, then logic and advancing knowledge. Those three carry about 84% of what the sub-ratings explain.
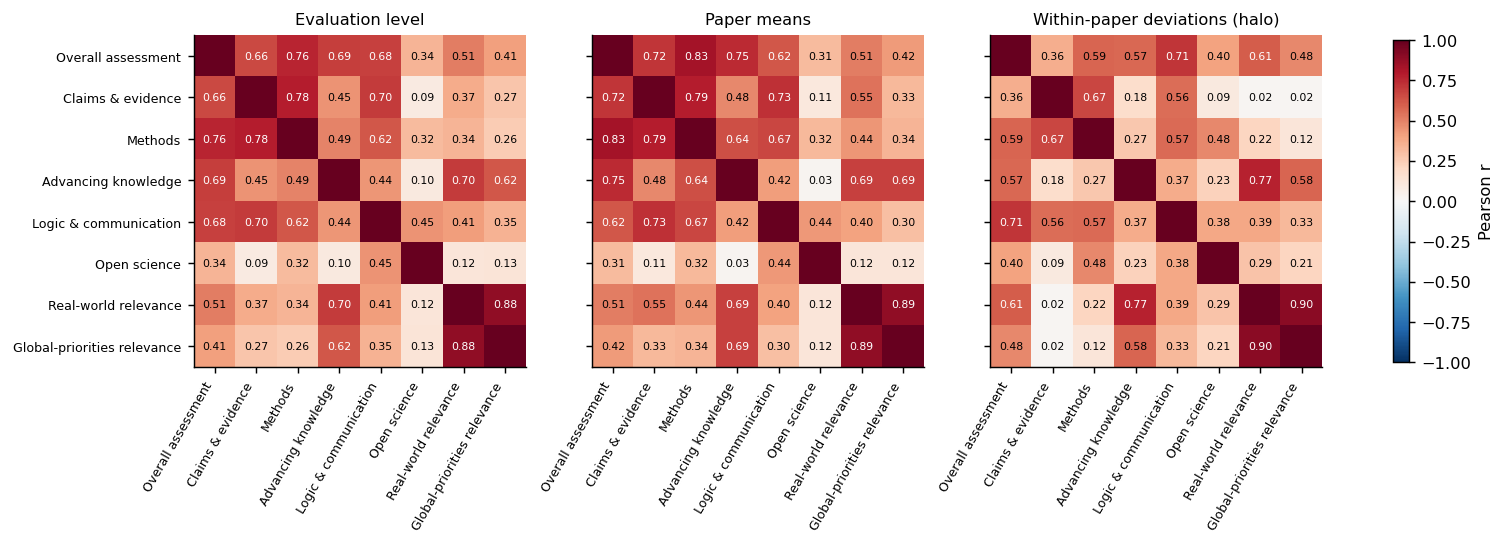
- The two relevance criteria do correlate with overall (about 0.45 to 0.5) and carry 10 to 15% of the explained share. But once you know a paper's methods, logic and advancing-knowledge ratings, its relevance ratings tell you little more about its overall rating. Relevance overlaps strongly with advancing knowledge, which already asks about global priorities.
- The opposite signs for the two relevance coefficients don't mean anything; they're nearly the same variable (see the copying issue above), and the regression can't separate them. Combining them into one relevance index gives a unique effect of 0.03 [−0.14, 0.19].
- Open science barely relates to overall at all.
Is that what we want? Yes. The overall rating is meant to be a judgment of research quality and contribution. Importance for global priorities is mainly something The Unjournal filters for when choosing which papers to evaluate; it isn't the main thing we ask evaluators to judge. So the pattern above is roughly what we'd hope for. Readers who want the relevance judgment can see it as a separate rating.
Robustness
Using paper averages instead of individual evaluations (54 papers) gives R² = 0.80 and the same pattern (methods 42% of the explained share, advancing knowledge 26%, logic 16%, relevance 13%, open science 1%). Using only evaluations from 2025 on, with global relevance alone, relevance's share rises to 14% and its unique effect to 0.18 [−0.04, 0.39], so relevance may matter somewhat more in recent evaluations. We can't tell with 48 evaluations.
We also found a "halo" pattern: when one evaluator is more generous than the co-evaluator on one criterion, they tend to be more generous on all of them (deviations from the paper average correlate about 0.4 across criteria). So some of what the sub-criteria share is the evaluator, not the paper.
Which questions are worth asking
One useful frame is to sort each question by two properties: is it measured reliably, and does it tell us something the other questions don't? The table below is the AI's reading of where each question falls, with the evidence; the suggestions in the last column are AI-generated and not yet decisions.
| Question | Reliable? | Adds something distinct? | AI suggestion |
|---|---|---|---|
| Methods | Moderately (α 0.50) | Yes, the main driver of overall | Keep |
| Overall | Moderately (0.45) | Mostly predicted by sub-ratings (74%) | Keep as the headline, but report relevance next to it |
| Claims and evidence | Moderately (0.43, only 20 papers) | Overlaps methods (0.8) | Keep; sharpen the boundary with logic (below) |
| Logic and communication | Weakly (0.30) | Partly | Keep; narrow to reasoning and exposition |
| Advancing knowledge | Weakly (0.22), long tail of big gaps | Overlaps overall and relevance | Consider splitting into "what we learn" and "decision value" |
| Global-priorities relevance | Weakly (0.32) | Distinct from overall | Keep; consider separating "importance of the question" from "usefulness of this answer" |
| Real-world relevance | — | Folded into global relevance | Already dropped; stop filling it at import |
| Open science | No (0.08) | Unrelated to everything | Replace the percentile with a checklist |
| Journal tier: should | Weakly (0.31) | Close to overall (0.77) | Keep, with sharper wording on the difference from "will" |
| Journal tier: will | Moderately (0.41) | Resolves against outcomes | Keep; the best calibration opportunity |
Why open science looks broken as a percentile
Evaluators disagree by 19 points (median) on it, papers barely differ on it once that disagreement is removed, it's unrelated to the other criteria, and no LLM we tested ranks papers on it the way the humans do (the two frontier models also rate it 17 to 20 points lower). That pattern suggests evaluators are judging different things: data and code availability, preregistration, transparency of methods, general replicability. Most of these are checkable facts. A short checklist (data available? code? preregistered? materials? reproducibility checked?) would be more reliable and more useful to readers, with an optional summary percentile.
Claims vs logic
The current guidance for claims asks about the strength of evidence and whether the authors characterize it correctly; the logic guidance also asks whether conclusions follow from the evidence and whether evidence is characterized correctly. Making claims about "what's claimed and how strong is the evidence" and logic about "does the reasoning follow, and is it clearly communicated" would make disagreements easier to interpret.
A caveat on all of this: "adds something distinct" here means "isn't predicted by the other ratings". The real test of usefulness is whether a question helps predict something we care about (later publication, citations, replication, policy use, or whether readers find it useful). We don't yet have enough outcomes to run that test except for journal placement.
How LLM ratings compare
Our separate LLM evaluation project asked several models to rate the same papers with the same rubric. We re-used those ratings for 47 matched papers.
What other studies find
For ICLR 2026 submissions, two human reviewers' scores correlated only 0.18; GPT-5.1's scores correlated 0.26 with a human's, and two LLMs agreed with each other far more (0.49) than with humans (Baumann et al. 2026). Earlier work found GPT-4's written comments overlapped with a human reviewer's about as much as two humans' did (Liang et al. 2024). We found no published comparison for economics papers.
The fair comparison: for papers with two human evaluations, how well does the model track one randomly chosen human, compared with how well the other human tracks that same person?
| Criterion | Papers | Second human | GPT-5 Pro | Claude Opus 4.6 | Gemini 2.0 Flash | GPT-4o-mini |
|---|---|---|---|---|---|---|
| Overall | 29–39 | 0.37–0.39 | 0.52 | 0.48 | 0.33 | 0.15 |
| Methods | 27–38 | 0.28–0.42 | 0.51 | 0.43 | 0.18 | 0.11 |
| Advancing knowledge | 28–38 | 0.14–0.26 | 0.48 | 0.37 | 0.21 | 0.14 |
| Logic and communication | 28–39 | 0.26–0.36 | 0.32 | 0.24 | 0.14 | 0.00 |
| Global relevance | 28–38 | 0.19–0.25 | 0.35 | 0.29 | 0.15 | 0.17 |
| Open science | 28–39 | −0.05–0.17 | 0.15 | 0.04 | −0.05 | −0.13 |
| Journal tier: will | 22–29 | 0.33–0.48 | 0.68 | 0.63 | — | 0.30 |
The two frontier models track a single human at least as well as a second human does on overall, methods, advancing knowledge and the "will" tier. The cheaper models don't. The samples are small (about 30 to 40 papers), so read these as "comparable", not "better".
Two cautions:
- Different scale use. GPT-5 Pro rates about 6 points above humans on overall and spreads its ratings less (standard deviation 10 against about 14 for humans). Claude Opus 4.6 rates about 8 below with a human-like spread. Mixing raw LLM numbers with human ones would distort averages. Adding GPT-5 Pro as a third rater actually lowers alpha because of this offset.
- Open science. No model's ranking of papers matches the humans', and the two frontier models rate it 17 to 20 points lower. Models reading a PDF can't easily check data and code availability, and the humans don't agree with each other either.
One promising use: show the cases where both humans agree and the model strongly disagrees, or where the humans disagree and the model sides with one. Those cases may teach more about the rubric than another correlation.
Possible changes (AI-generated suggestions)
These suggestions were drafted by AI (GPT-5 Pro and Claude) from the analysis above. We're listing them because they seem reasonable, not because we've decided on them; we'd like more human views before treating any as a priority. Two items marked "in progress" were simple data and form fixes we've already started. The rest are ordered roughly by the AI's estimate of value for effort. Tags: easy fix form change test first.
Data pipeline
- easy fix Copy approved form submissions into the ratings table (the three 2026 packages are missing), standardize criterion names at import, and stop filling real-world relevance from global relevance. In progress.
- easy fix Automated checks on every data refresh: impossible intervals, duplicates, near-duplicate titles, fields copied into other fields, heaping, interval widths of zero, and a rubric-version field so structural missingness isn't mistaken for nonresponse.
- easy fix Keep a stable hashed evaluator key in the private data so evaluator-level questions (are some evaluators consistently harsher?) can be answered internally. Publish only aggregates.
Evaluation form
- form change Next to each slider, show how much experts typically disagree on that criterion ("evaluators of the same paper usually differ by about 10 points, and one pair in five by more than 20"). Warn when an interval is narrower than 10 points or has zero width. Block impossible intervals and tier bounds outside 0–5. A first version of these hints and warnings is now on the evaluation form (October 2026); it still needs human review.
- form change Replace the open-science percentile with a short checklist of verifiable items.
- form change Sharpen the "should vs will" wording: for example, ask "will" first, then "if journals judged only on merit, where should it go?"
- form change Tighten the claims/logic boundary; consider splitting advancing knowledge.
- test first Anchor papers for calibration practice: a small set rated by many evaluators, with the reference distribution shown. The current calibration tool compares with a uniform distribution, which is only right for a random sample of papers.
- test first Whether intervals on every criterion are worth the effort. One option: intervals only for overall, methods and the "will" tier, with a simple low/medium/high confidence elsewhere. Compare completion time, missing answers and reliability.
- test first As one option for the "will" tier: probabilities over tiers 0 to 5 instead of a midpoint and interval. That would let us score forecasts properly once papers are published. It's more demanding to answer, so it's worth trying on a subset first.
- test first Ask the sub-criteria before overall, so overall is a synthesis rather than an anchor. Easy to randomize.
Reporting
- easy fix Report reliability in percentile points ("experts typically differ by about 10 points") next to any coefficient, and drop the "acceptable/good" labels.
- easy fix Show overall and global-priorities relevance side by side rather than as one summary number.
- easy fix Round published averages to the nearest 5, and indicate that a two-evaluator average on overall has a standard error of roughly 8 points from evaluator noise alone.
- test first A standardized LLM rating as a separate, clearly labeled signal, adjusted for the model's offset, never averaged in raw.
- test first A short "why do the evaluators disagree?" note from the evaluation manager when a pair is far apart (different reference group, different reading of the criterion, different evidence, different priorities). This turns disagreement into information about the form.
Open questions
We'd especially welcome comments on these.
- Our current view is that "overall" should stay a judgment of research quality and contribution, since we filter for global-priorities importance when selecting papers. Does the guidance to evaluators make that clear enough, and should the global-relevance rating be framed more explicitly as a separate, secondary question?
- How much should we ask of evaluators? Every extra question and interval costs time; which ones are worth it?
- Can we get a few evaluators to rate shared anchor papers, so we can separate selection from leniency?
- Is "advancing knowledge" one question or two?
- Are named and anonymous evaluators' ratings comparable? On the same paper, anonymous evaluators rate about 5 points lower. That rests on about 15 papers with one of each, so it needs more data, but if it holds it matters for averages.
- Which outcomes should we use to judge which questions are useful: journal placement, citations, replications, policy citations, reader feedback?
Sources and how this was made
Sources
- Data: The Unjournal's public ratings export, refreshed on 16 October 2026 after the data corrections described in section 2 (duplicates removed, split titles merged, several intervals corrected against the published evaluations, and the 2026 evaluations added). Coverage: all evaluation packages published through September 2026 with numeric ratings, except the Yellow Vests independent evaluation, which has no ratings table. A few older evaluations have no numeric ratings on some criteria, which is why counts differ by criterion. Also journal outcomes from OpenAlex and our database, and LLM ratings from the LLM evaluation project.
- Earlier analyses: A first look at Unjournal's data (David Hugh-Jones, 2024) and Deeper analysis with more evaluations (2025).
- GPT-5 Pro Deep Research report (October 2026, commissioned by David Reinstein): contributed the alpha-as-remaining-disagreement reading, the signal-to-noise and averaging framing, the critique of interval coverage as calibration, the selection-versus-inflation point, the within-rater audit, the reliability-by-usefulness frame, and many of the form suggestions. Where its numbers came from the 2025 post, we recomputed them on current data.
- Claude (Fable 5.1, then Opus 5.5) did the data analysis (code:
code/analyze_ratings_quality.py), the QA checks, the regression decomposition, the cross-evaluator benchmark, the LLM comparison and this page. Some verification runs were done by Claude agents on cheaper models. - Anonymity: no evaluator is named or identifiable here. Evaluator-level checks used hashed identifiers and report only counts.
Earlier version and what changed
An earlier, Claude-only draft from the same day is archived at v1. Main differences:
- The very high correlation between real-world and global relevance (0.89) is largely a copying artifact from 2025 on. v1 treated it as evidence they measure the same thing.
- "Overall gives zero weight to relevance" is replaced by an explicit decomposition: relevance's unique contribution is near zero, but it carries 10 to 15% of the shared explanatory power.
- v1 suggested making the "should" tier optional. We now recommend keeping both tier questions, and flag that the overlap in answers may partly be a data artifact.
- "Calibration" of intervals is now called cross-evaluator coverage, with the benchmark explained step by step.
- Added: disagreement in percentile points, alpha read as remaining disagreement, the reliability of averages, a data-quality section, the audit of the 2025 post's within-rater correlations, and the reliability-by-usefulness frame for each question.
- Two papers split across title variants are now merged (59 papers rather than 61), which adds a few pairs.
- v1's anonymity result now carries a note that it rests on about 15 papers.